Basic Usage
This tutorial will go through the basic usage of tiltlib, such as how to initialize a sample, and plotting
[1]:
# Import the necessary packages
%matplotlib inline
from orix.vector import Miller, Vector3d
import numpy as np

from tiltlib import Axis, Sample
Axis initialization
To rotate a sample, one needs rotation axes. In tiltlib, these are represented as Axis objects. These are initialized with a direction and a tilt range.
[2]:
x_tilt_axis = Axis(
    Vector3d.xvector(),
    min = -30,
    max = 30,
    degrees = True,
)
x_tilt_axis
[2]:
Axis:
        direction = [1, 0, 0]
        angle = 0.00 degrees
        range: (-30.00, 30.00) degrees
        extrinsic
Sample initialization
The main workhorse of tiltlib is the Sample. This object consists of crystal orientations, and rotation axes.
This can be initialized in two ways: with a CrystalMap from Orix, or with Orientation and a Phase (also from Orix).
[3]:
## Orientations

from orix.quaternion import Orientation
from orix.crystal_map import Phase

# Make a hexagonal crystal.
# The default lattice is cubic, so we edit it
phase = Phase(point_group="6/mmm")
phase.structure.lattice.setLatPar(gamma=120)

# Make some random data
oris = Orientation.random((10, 10))
oris.symmetry = phase.point_group
oris = oris.map_into_symmetry_reduced_zone()

# Initialize the sample
sample = Sample(oris, phase, [x_tilt_axis])
sample
[3]:
Sample:
Axis:
        direction = [1, 0, 0]
        angle = 0.00 degrees
        range: (-30.00, 30.00) degrees
        extrinsic
[4]:
## CrystalMap

# Download a crystal map supplied by Orix
from orix.data import sdss_austenite
raw_xmap = sdss_austenite(allow_download=True)

# Initialize the sample object
sample = Sample.from_crystal_map(raw_xmap, [x_tilt_axis])

sample
Downloading file 'sdss/sdss_austenite.h5' from 'https://github.com/pyxem/orix-data/raw/main/sdss_austenite/sdss_austenite.h5' to '/home/runner/.cache/orix/0.12.1.post0'.
100%|█████████████████████████████████████| 10.8M/10.8M [00:00<00:00, 19.5GB/s]
[4]:
Sample:
Axis:
        direction = [1, 0, 0]
        angle = 0.00 degrees
        range: (-30.00, 30.00) degrees
        extrinsic
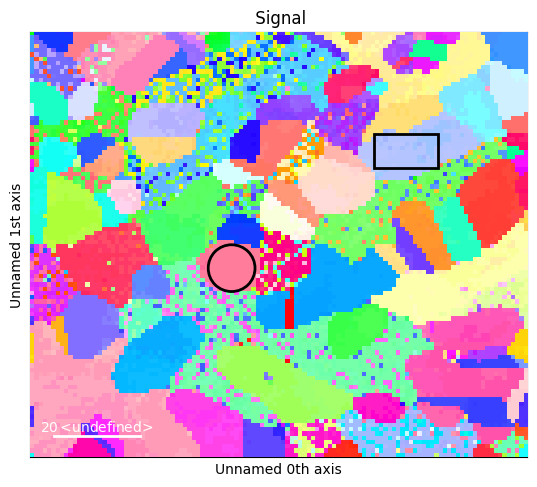
Cropping
Samples can be cropped with Hyperspy ROIs
[5]:
# Create an IPF navigation signal
nav = sample.to_navigator()
nav.plot()

# Create ROIs
from hyperspy.roi import RectangularROI, CircleROI

rect = RectangularROI(left=81, top=24, right=96, bottom=32)
rect.interactive(nav, color="black")

circ = CircleROI(cx=47, cy=55, r=5.5, r_inner=0)

# For some reason, numpy throws an error with the circle
try:
    circ.interactive(nav, color="black")
except np.exceptions.DTypePromotionError:
    pass
[6]:
rect_sample = sample.crop(rect)
circ_sample = sample.crop(circ)
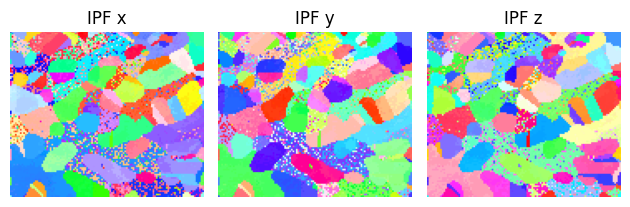
Plotting
There are multiple plotting tools directly available from the Sample object. Additionally, the Orientation member is always up-to-date with the rotation of the sample, making them available for custom plotting.
[7]:
## IPF colormap
sample.plot()
[7]:

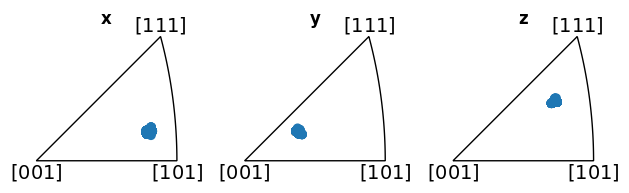
[8]:
## Orientations as IPF scatterplot
# Use one of the crops, as the full sample has so many different orientations
rect_sample.plot_orientations()
[8]:

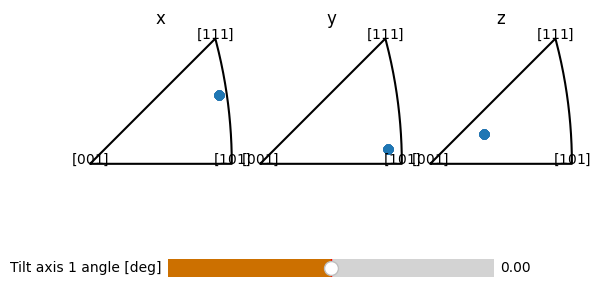
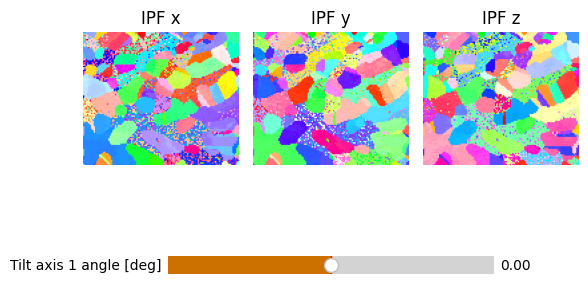
Interactive plotting
Some plotting functionality of tiltlib is interactive, where you control the tilt axes with sliders
[9]:
# IPF colormaps
sample.plot_interactive()
/opt/hostedtoolcache/Python/3.11.9/x64/lib/python3.11/site-packages/tiltlib/sample.py:228: UserWarning: constrained_layout not applied because axes sizes collapsed to zero.  Try making figure larger or Axes decorations smaller.
  tilt_slider = Slider(
[9]:
(<Figure size 640x480 with 4 Axes>,
 (<matplotlib.widgets.Slider at 0x7fd13657cd10>,))
/opt/hostedtoolcache/Python/3.11.9/x64/lib/python3.11/site-packages/IPython/core/pylabtools.py:170: UserWarning: constrained_layout not applied because axes sizes collapsed to zero.  Try making figure larger or Axes decorations smaller.
  fig.canvas.print_figure(bytes_io, **kw)
[10]:
# IPF scatterplot
circ_sample.plot_orientations_interactive()
/opt/hostedtoolcache/Python/3.11.9/x64/lib/python3.11/site-packages/tiltlib/sample.py:305: UserWarning: constrained_layout not applied because axes sizes collapsed to zero.  Try making figure larger or Axes decorations smaller.
  tilt_slider = Slider(
[10]:
(<Figure size 640x480 with 4 Axes>,
 (<matplotlib.widgets.Slider at 0x7fd134bf7810>,))